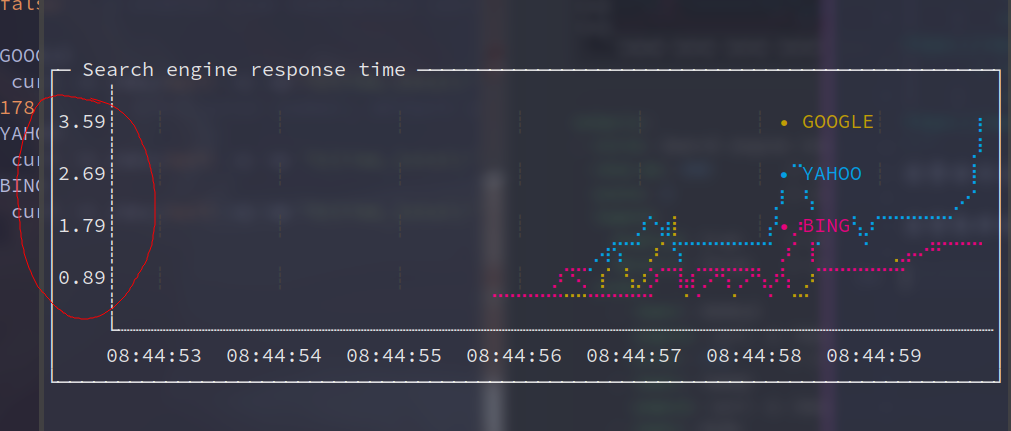
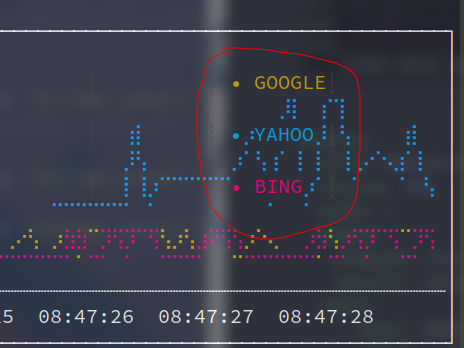
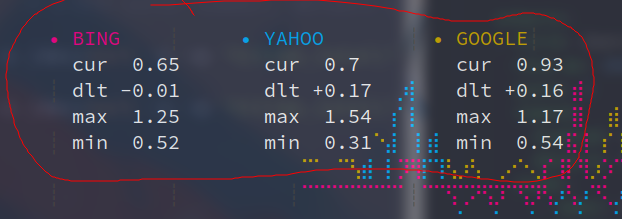
items: -label:GOOGLE sample:curl-o/dev/null-s-w'%{time_total}'https://www.google.com color:178# 8-bit color number, default one is chosen from a pre-defined palette -label:YAHOO sample:curl-o/dev/null-s-w'%{time_total}'https://search.yahoo.com -label:BING sample:curl-o/dev/null-s-w'%{time_total}'https://www.bing.com
gauges: -title:Minuteprogress rate-ms:500# sampling rate, default = 1000 scale:2# number of digits after sample decimal point, default = 1 percent-only:false# toggle display of the current value, default = false color:178# 8-bit color number, default one is chosen from a pre-defined palette cur: sample:date+%S# sample script for current value max: sample:echo60# sample script for max value min: sample:echo0# sample script for min value -title:Yearprogress cur: sample:date+%j max: sample:echo365 min: sample:echo0
设置多个分屏
添加多个 title 即可.
设置只显示百分数
1
2
-title:test percent-only:true# toggle display of the current value, default = false
设置颜色
1 2
-title:test color:178# 8-bit color number, default one is chosen from a pre-defined palette
textboxes: -title:Localweather rate-ms:10000# sampling rate, default = 1000 sample:curlwttr.in?0ATQF border:false# border around the item, default = true color:178# 8-bit color number, default is white -title:Dockercontainersstats rate-ms:500 sample:dockerstats--no-stream--format"table {{.Name}}\t{{.CPUPerc}}\t{{.MemUsage}}\t{{.PIDs}}"
是否添加边框
1 2
- title: Local weather border: false # border around the item, default = true
asciiboxesa 示例
1 2 3 4 5 6 7
asciiboxes: -title:UTCtime rate-ms:500# sampling rate, default = 1000 font:3d# font type, default = 2d border:false# border around the item, default = true color:43# 8-bit color number, default is white sample:envTZ=UTCdate+%r
设置字体
可选的为 2d 和 3d.
1
2
3
asciiboxes: -title:UTCtime font:3d# font type, default = 2d
设置主题
1 2 3 4
theme:light# default = dark sparklines: -title:CPUusage sample:ps-A-o%cpu|awk'{s+=$1} END {print s}'
gauges: -title:MINUTEPROGRESS position: [[0, 18], [80, 0]] cur: sample:date+%S max: sample:echo60 min: sample:echo0 triggers: -title:CLOCKBELLEVERYMINUTE condition:'[ $label == "cur" ] && [ $cur -eq 0 ] && echo 1 || echo 0'# expects "1" as TRUE indicator actions: terminal-bell:true# standard terminal bell, default = false sound:true# NASA quindar tone, default = false visual:false# notification with current value on top of the component area, default = false script:say-vsamantha`date+%I:%M%p`# an arbitrary script, which can use $cur, $prev and $label variables
在 sample 之前和之后的处理
在 sample 之前运行 (有且运行一次), 用 init.
对每一次 sample 之后处理, 用 transform.
1 2 3 4 5 6
textboxes: -title:MongoDBpolling rate-ms:500 init:mongo--quiet--host=localhosttest# executes only once to start the interactive session sample:Date.now();# executes with a required rate, in scope of the interactive session transform:echoresult=$sample# executes in scope of local session, $sample variable is available for transformation
需运行多条命令的 init 用 `multistep-init:
1
2
3
4
5
6
7
textboxes:
  - title: Java application uptime
    multistep-init:
      - java -jar jmxterm-1.0.0-uber.jar
      - open host:port # or local PID
      - bean java.lang:type=Runtime
    sample: get Uptime